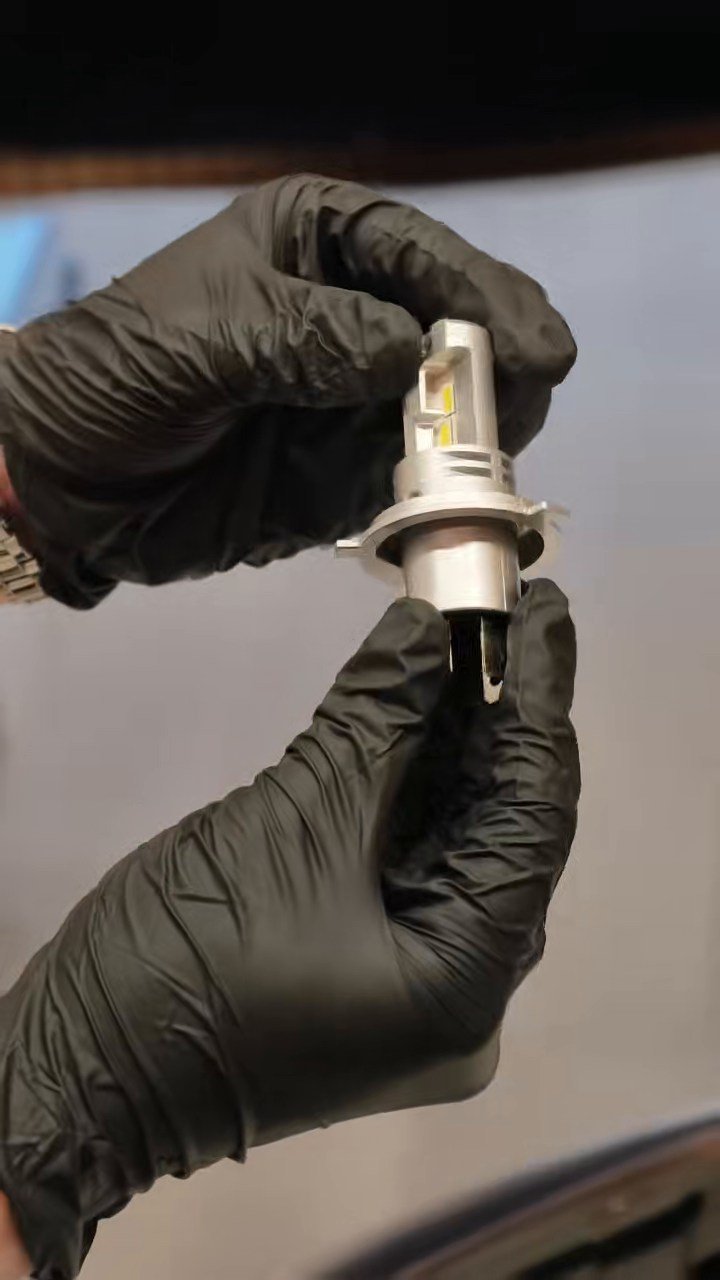
01 / BULB
Identify the LED bulb
Real footage documents the AUXITO H4 lamp and its physical construction.
An unedited-measurement, edited-for-viewing test: AUXITO H4 bulb inspection and installation, an approximately 3 m setup, separate low/high-beam readings, then a full 4m 34s low-beam Continuous Test played at 10× speed.
English vertical video. The headlight and phone readings are real filmed scenes; the Continuous Test interval is shown from start to finish at 10× playback speed, followed by the APP statistics.
The 10× interval is an accelerated presentation of the recorded footage. It is not a real-time playback of four and a half minutes.
Test setup
The original clips were reorganized into the actual testing order. The footage shows an AUXITO H4 LED bulb installed in a headlight assembly, with the distance checked by tape before measuring the illuminance reaching the HL200 sensors.
Real footage documents the AUXITO H4 lamp and its physical construction.
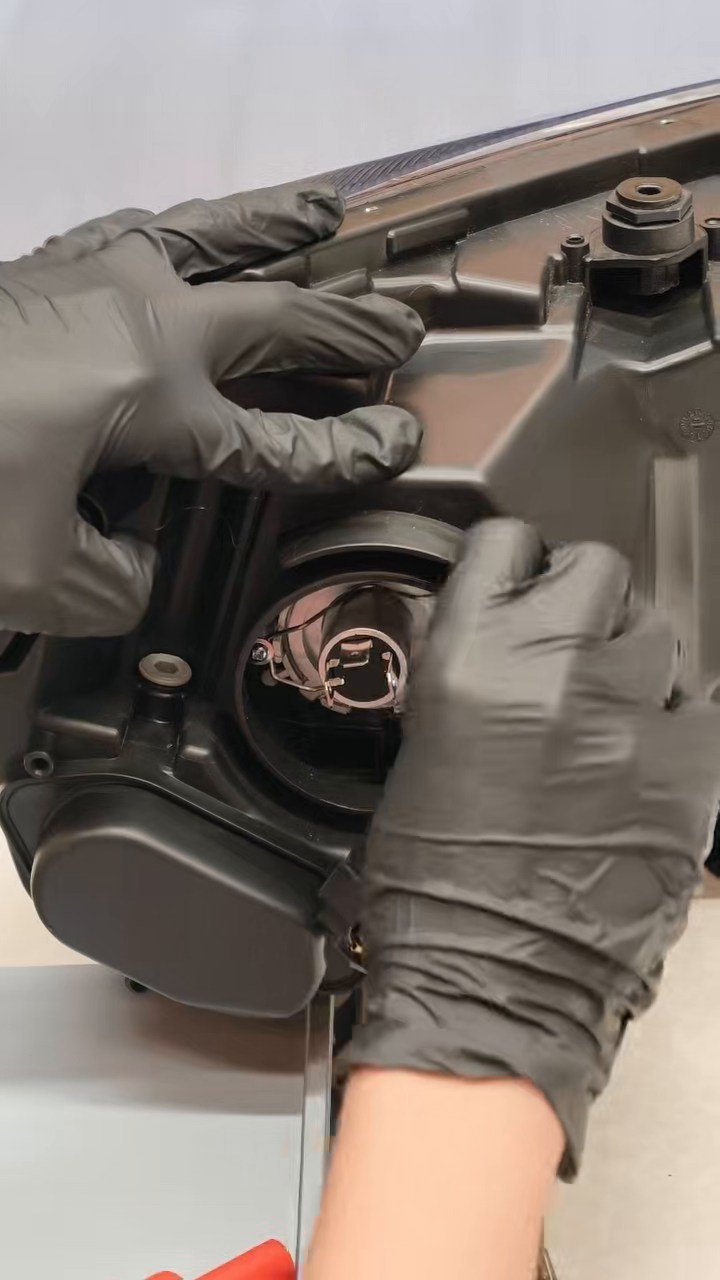
The bulb is fitted to the test headlight housing before illumination is measured.
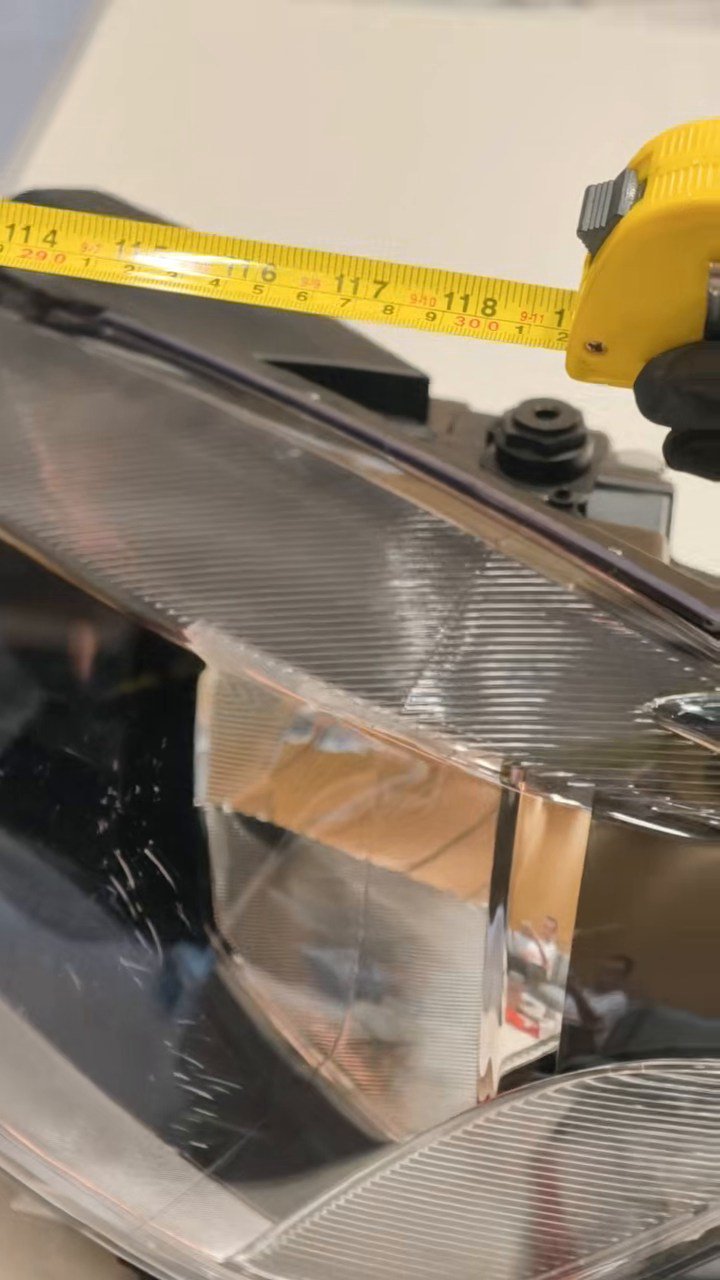
A tape measure records the test separation; the results apply to this setup, not all distances.
Low beam → High beam → Back to low
These are illuminance readings at two fixed sensor positions, recorded under different beam modes. The low-beam and high-beam values are not interchangeable measurements of total bulb output.
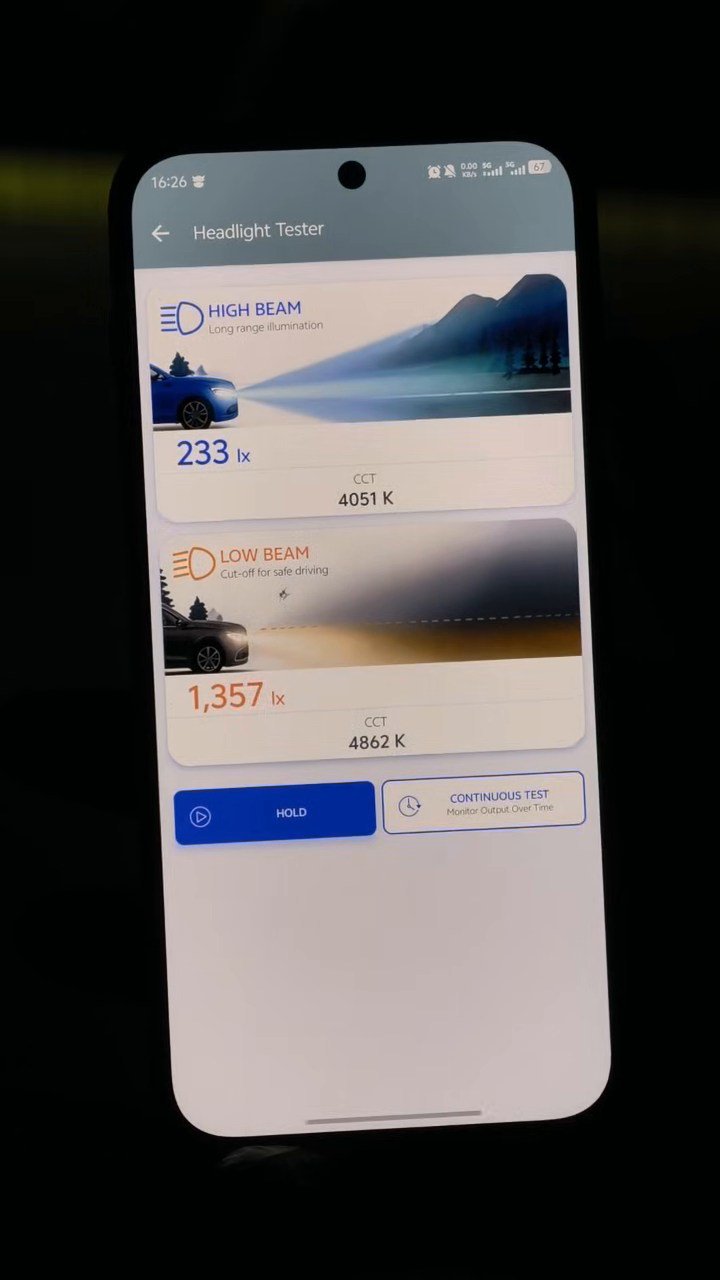
Illuminance reaching the low-beam sensor position in low-beam mode.
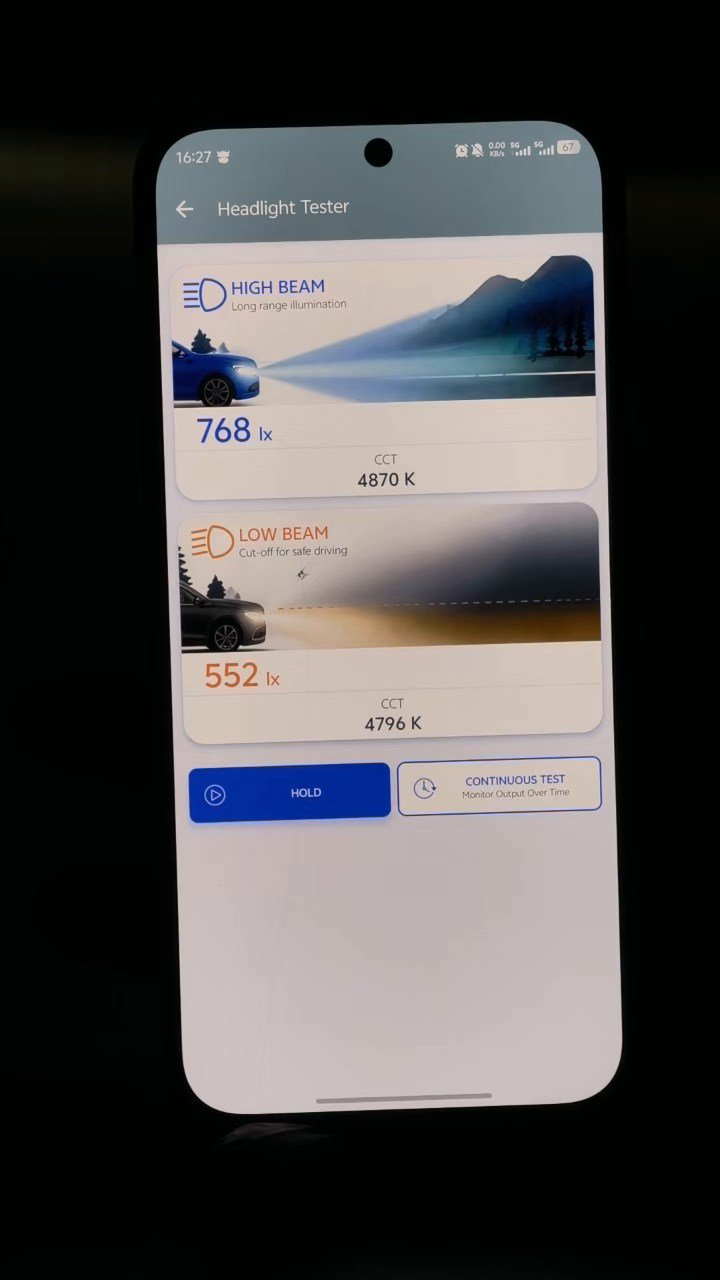
Illuminance reaching the high-beam sensor position after switching modes.
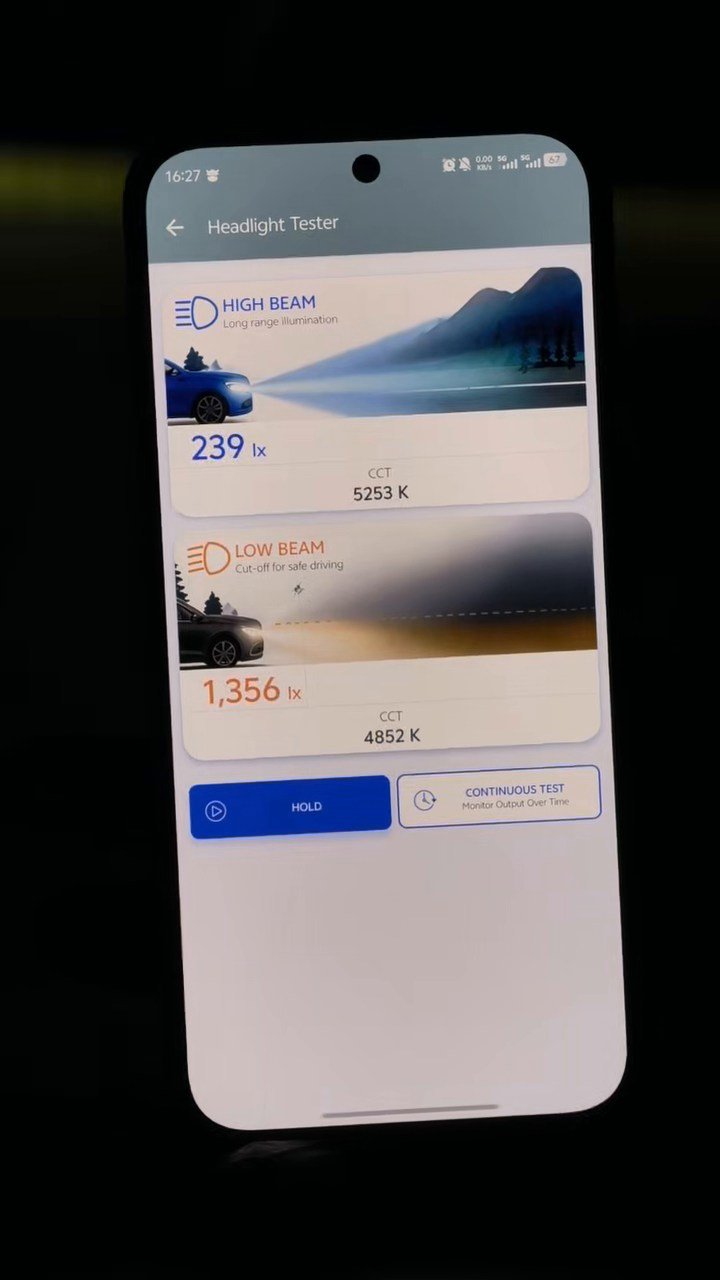
Low-beam sensor reading after switching from high beam back to low beam.
Low-beam Continuous Test
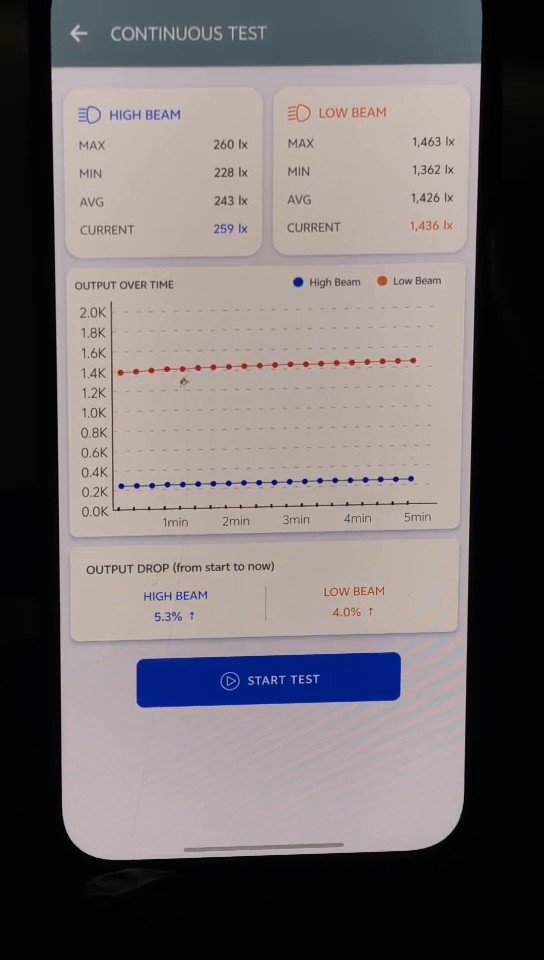
After returning to low-beam mode, the HL200 recorded approximately 4m 34s of continuous data. The entire filmed interval is presented at 10× speed in the video above. The table below reproduces the displayed low-beam sensor statistics from the final APP result screen.
| APP measurement field | Low-beam sensor position |
|---|---|
| Maximum (MAX) | 1,463 lx |
| Minimum (MIN) | 1,362 lx |
| Average (AVG) | 1,426 lx |
| Current at end | 1,436 lx |
| APP-indicated change vs starting reference | +4.0% |
| Recorded Continuous Test video length | 4m 34s |
The APP indicated an increase of 4.0% at the low-beam sensor position relative to the instrument's starting reference. It does not establish that the LED bulb's total lumen output or electrical power rose by 4.0%.
The 1,463 lx maximum and 1,362 lx minimum reveal a wider observed range during the timed record. This maximum-to-minimum spread is a different statistic from the APP's reference-to-current percentage.
Possible explanations for time-dependent changes would require further controlled trials; this short bench test alone does not identify the underlying cause.
Interpretation & limitations
They come from different sensor positions under different beam modes. The readings alone do not determine which light distribution produces better road illumination or whether the system is compliant.
Not established. The APP indicates a 4.0% increase in measured point illuminance relative to its starting reference. It is not a total-lumen or power measurement.
Yes. The submitted 4m 34s continuous-recording segment was played in chronological order at 10× speed in the edited English video. The source segment was not represented as real time.
No. A single bench setup, two sensor positions and a timed lux record do not establish road performance, glare compliance or long-term durability.