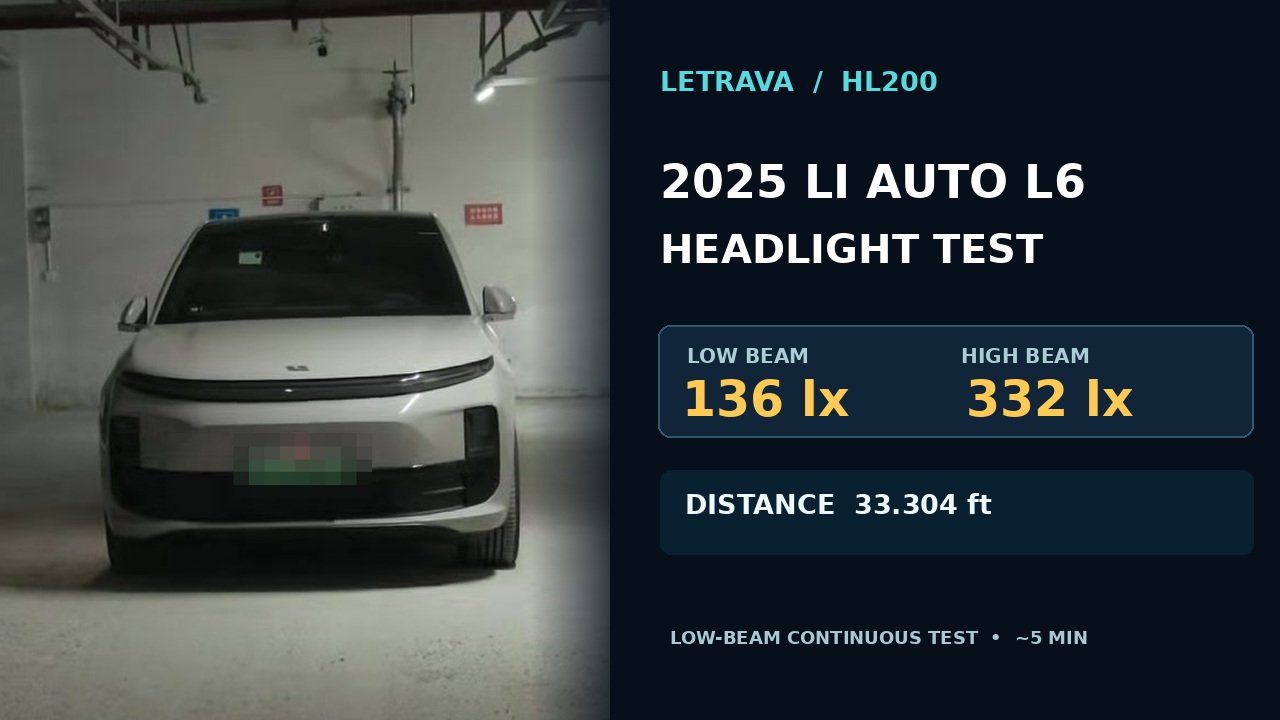
Watch the 2025 Li Auto L6 headlight test
The edited English video shows the actual vehicle and HL200 setup, laser-measured distance, low-beam live reading, high-beam live reading, selected scenes from the low-beam continuous test and the final measurement summary. The license plate is obscured. Original spoken audio was removed.
English · Landscape · Recorded test material, edited for viewing · Download / open test video
A real vehicle test with a laser-measured distance
The test took place in an indoor parking garage. The 2025 Li Auto L6 faced the HL200 measurement position, with the meter arranged on a tripod. The distance was checked using a laser distance meter rather than a tape measure. Its recorded display read 33.304 ft, equivalent to approximately 10.151 m.
2025 Li Auto L6 with factory headlight assemblies.
Laser-measured separation of 33.304 ft between the test positions.
Letrava HL200 used for illuminance (lx), CCT (K) and low-beam continuous monitoring.
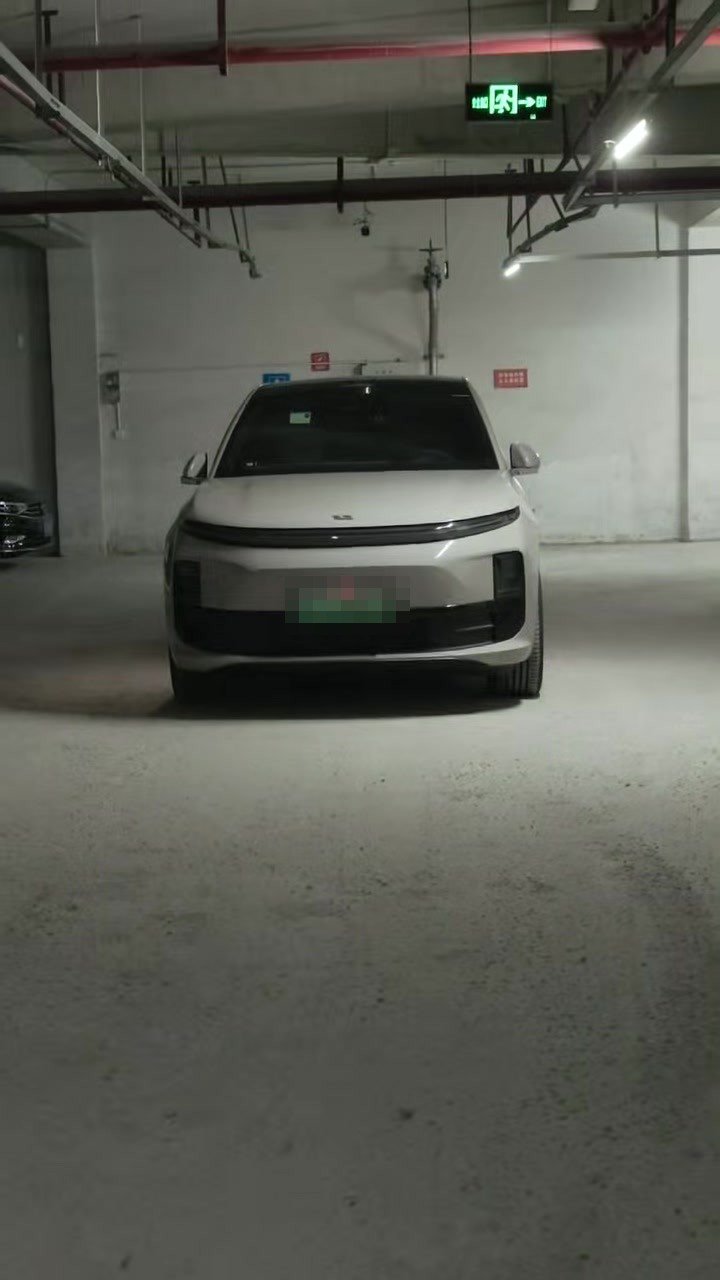
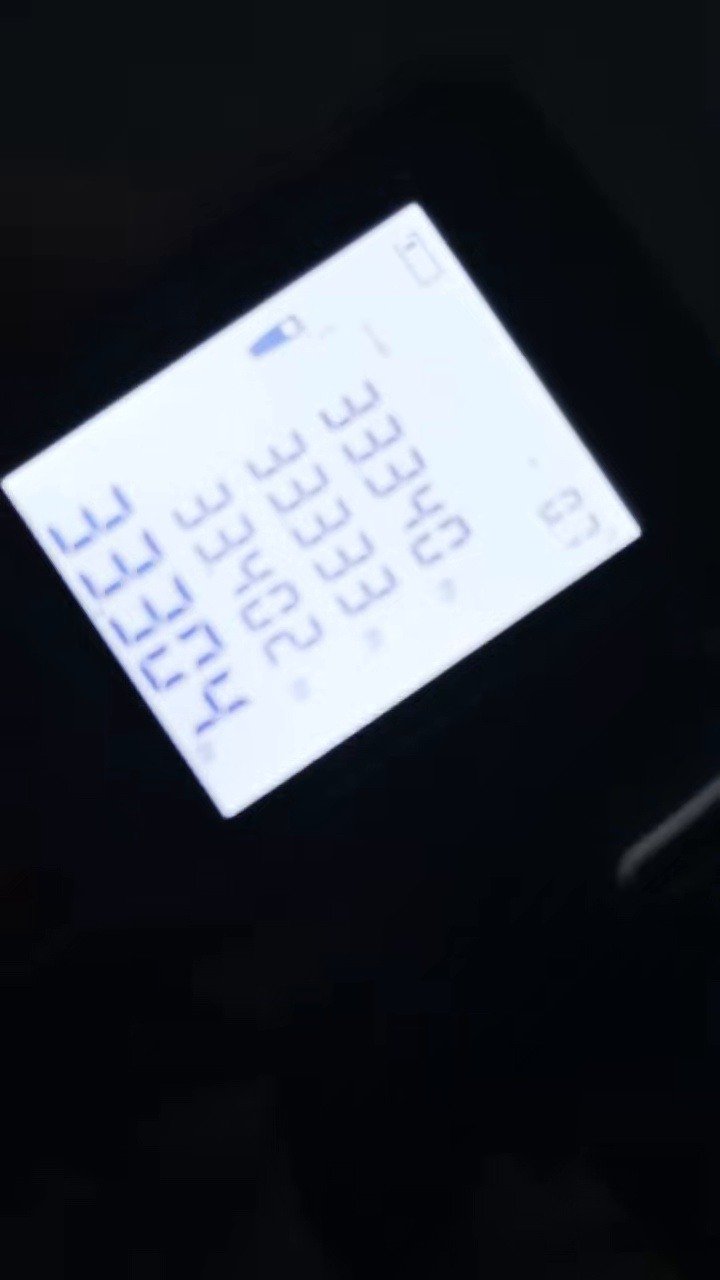
The ambient parking-garage lighting was not independently subtracted or mapped, and we have not supplied a beam-pattern grid, aiming diagram or multi-point road-illumination survey. These are observations at the recorded measurement setup, not a certified headlight performance rating.
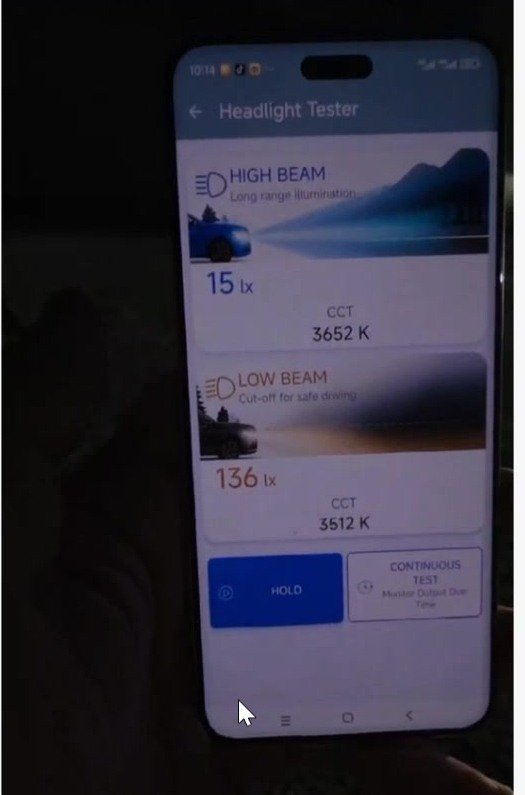
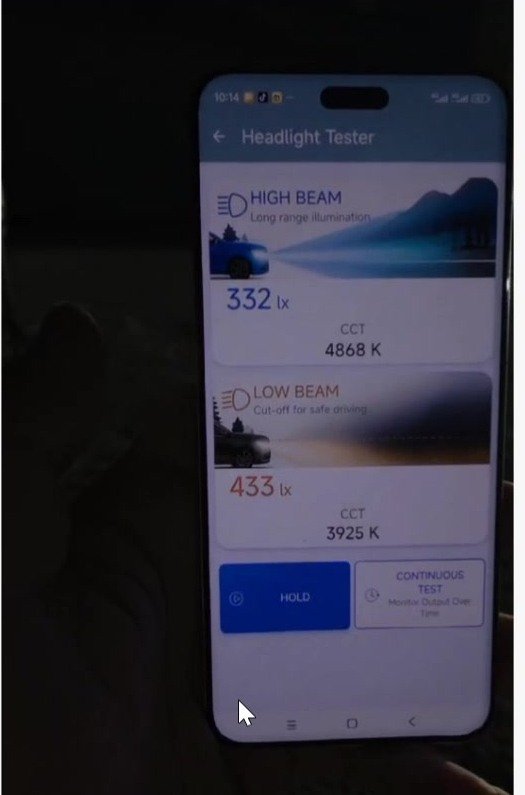
Low beam and high beam: actual Lux and CCT readings
First, we recorded a live low-beam reading; then we recorded a live high-beam reading. Both figures are taken from their respective on-screen beam labels in the source footage.
| Measurement | Low Beam | High Beam |
|---|---|---|
| Single live illuminance reading | 136 lx | 332 lx |
| Correlated color temperature | 3,512 K | 4,868 K |
| Distance recorded for setup | 33.304 ft | 33.304 ft |
| Continuous-test footage available? | Yes — approximately 5 minutes | No — live snapshot only |
At the chosen measurement location, the 332 lx high-beam reading was about 2.44 times the 136 lx low-beam reading. This comparison concerns the reported sensor readings in this setup. It is not a claim that the high-beam assembly emits 2.44 times as many total lumens, or that either beam illuminates the road a particular distance.
What happened during the low-beam continuous test?
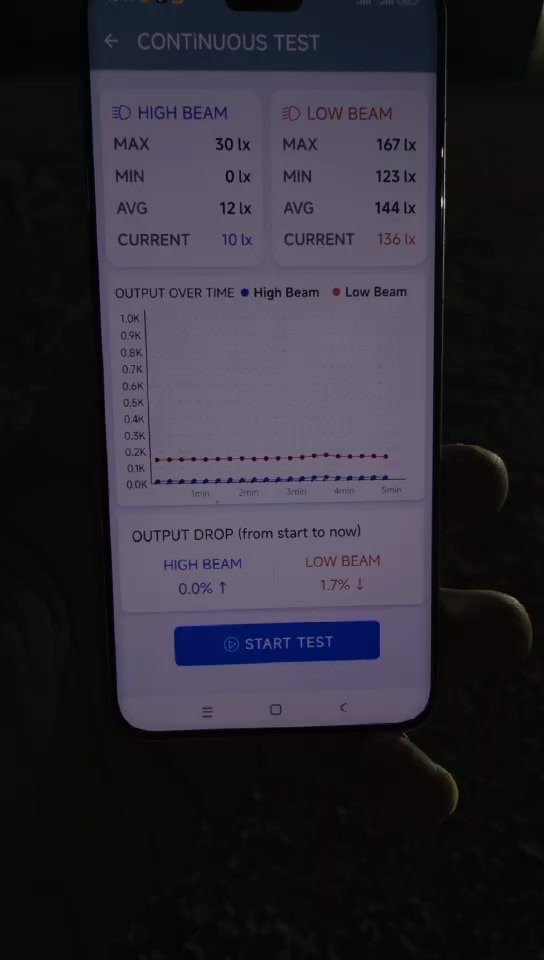
We also recorded the HL200 continuous-test screen for approximately five minutes while monitoring the low beam. The recorded trace includes changes over time; we report the final on-screen statistics rather than substituting values from other moments in the video.
| HL200 low-beam result | Recorded value |
|---|---|
| Maximum (MAX) | 167 lx |
| Minimum (MIN) | 123 lx |
| Average (AVG) | 144 lx |
| Current at the captured end | 137 lx |
| HL200 Output Drop (start to end) | 1.7% ↓ |
| MAX-to-MIN range (calculated separately) | 26.3% of MAX |
Why does 1.7% Output Drop differ from the MAX-to-MIN range?
The 1.7% figure is the HL200 application’s displayed change between its starting reference and the final reading. The maximum-to-minimum calculation is a different statistic: (167 − 123) ÷ 167 × 100 ≈ 26.3%. The latter captures the spread of observations across the run, not the net start-to-end change.
This means the final measurement was relatively close to the application’s starting reference, while the full recorded range was wider. Without controlled repeat trials and independent checks of ambient illumination, beam aim, vehicle control behavior and sensor position, the video does not establish the physical source of those excursions. It would be inaccurate to describe the entire run as varying by only 1.7%.
What can we conclude about these Li Auto L6 headlights?
What the recording supports
- At the reported 33.304 ft setup, the recorded low-beam snapshot was 136 lx / 3,512 K.
- The recorded high-beam snapshot was 332 lx / 4,868 K.
- At this sensor position, the measured high-beam lux reading exceeded the low-beam reading.
- The low-beam continuous-test screen ended with 137 lx and a displayed 1.7% Output Drop, while its recorded MAX-to-MIN range was larger.
What this test does not establish
- No high-beam Continuous Test was recorded, so there is no high-beam stability finding.
- A single-point lux reading does not measure total lumens, beam spread or glare.
- The setup does not constitute a road-safety assessment, regulatory photometry or a vehicle-to-vehicle ranking.
- Measurement-position effects, ambient light and other possible sources of variation were not fully isolated.
The strongest practical takeaway is methodological: measure each beam separately, document the geometry and record output over time where stability matters. A one-time lux number and a five-minute time series answer different questions.
Li Auto L6 headlight test FAQ
How far away was the HL200 placed?
A laser distance meter showed 33.304 feet, about 10.151 meters, for the recorded setup.
Is 332 lx high-beam output automatically “good”?
No. It is the illuminance at a particular measurement point. Headlight evaluation also depends on aim, beam distribution, glare, road geometry and other measurements.
Was the high beam continuously tested for five minutes?
No. Only the low beam has recorded Continuous Test footage. High-beam illuminance and CCT were captured as a live snapshot.
Does the 1.7% Output Drop mean there was no fluctuation?
No. The application’s start-to-end drop was 1.7%, whereas the lowest and highest recorded low-beam lux values were 123 lx and 167 lx.
Can the HL200 measure headlight lumens?
HL200 measures illuminance in lux and correlated color temperature (CCT) at its sensor. It does not measure whole-lamp lumens or electrical input power.
Compare headlights with measured data, not just impressions.
The Letrava HL200 headlight tester can record lux and CCT, organize low- and high-beam measurements and follow illuminance trends during continuous tests. The Li Auto L6 case illustrates why a documented measurement position and clear distinction between single readings and time-series statistics matter.
Explore the HL200 Headlight TesterSee another LED headlight testTest performed and documented November 15, 2026. This is an independent measurement case study by Letrava, not an official Li Auto specification, endorsement, certification or complete road-illumination evaluation. Li Auto and L6 are names of their respective owners.
Back to Letrava · HL200 product details · TERMITOR H4 LED test