Watch the actual SEALIGHT H4/9003 test
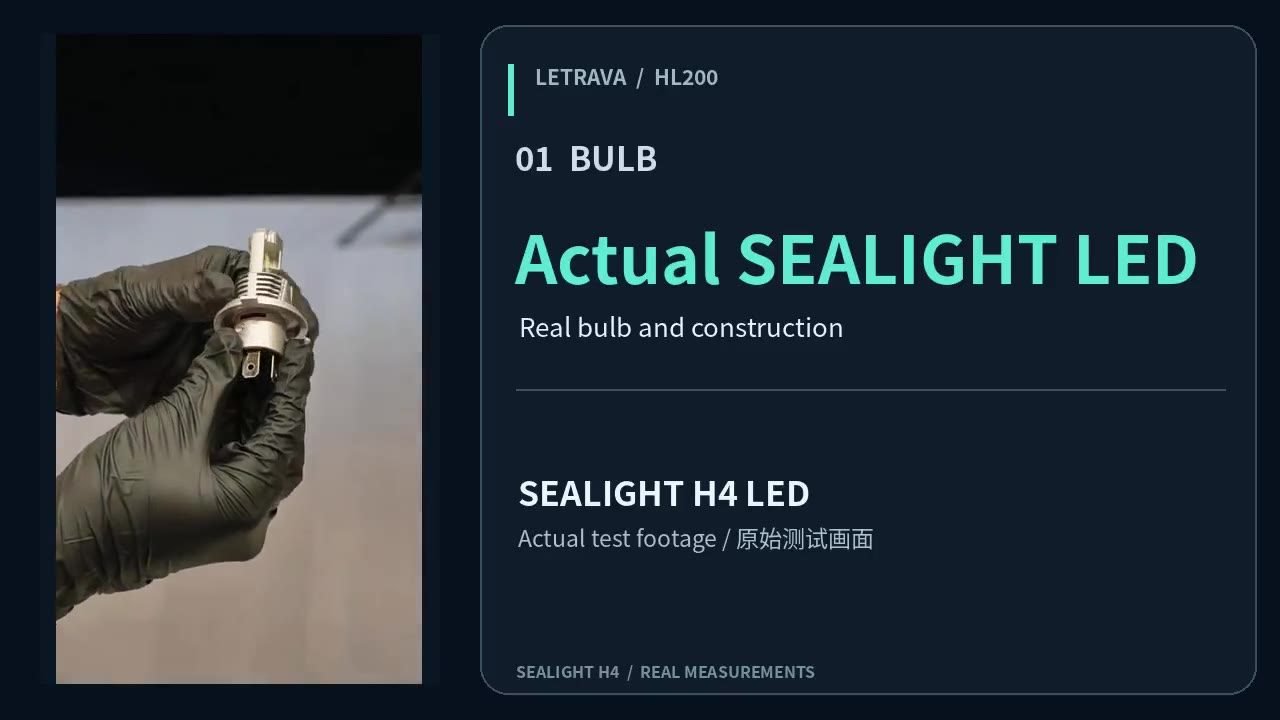
The English video follows the LED bulb, the test arrangement, tape-measured distance, recorded lux trends and the final instrument readings. The footage has been edited for clarity; it is not an uncut five-minute recording.
Original recorded material, edited with English explanatory graphics. Download English video (MP4).
How the measurement was carried out
- Bulb identification and setup. The footage shows the SEALIGHT H4 LED bulb and its bench headlight assembly setup.
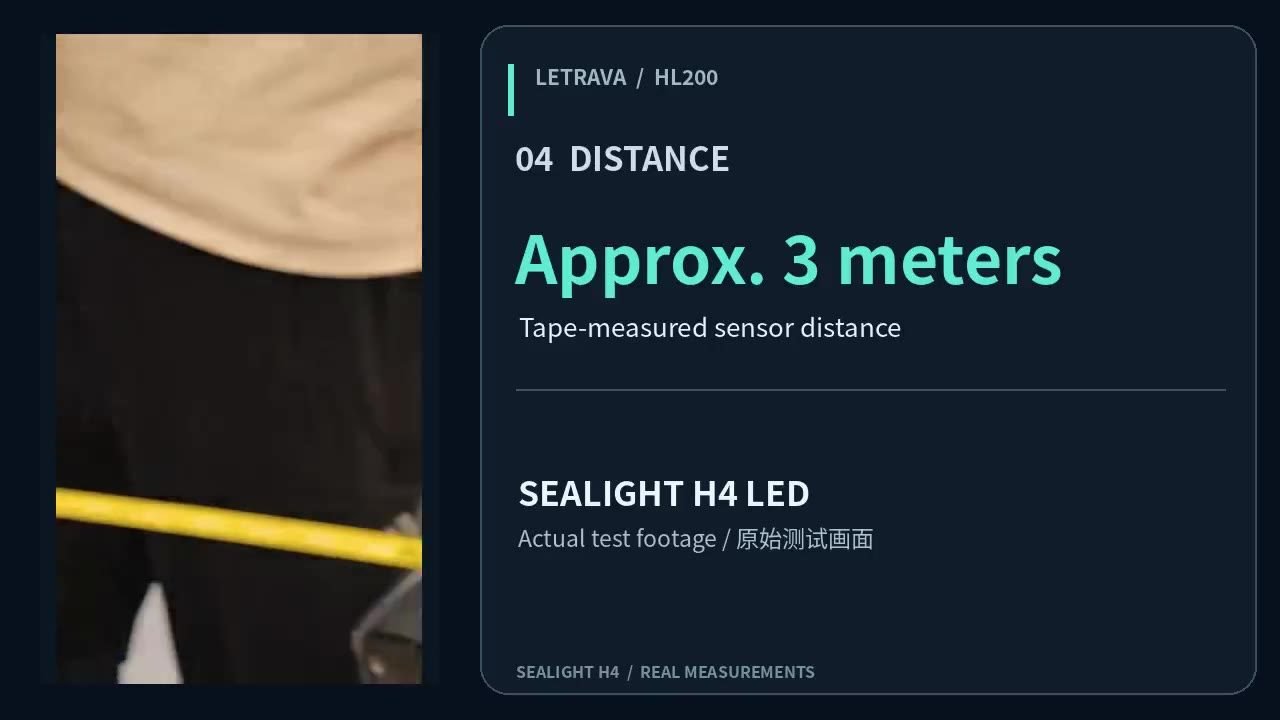
- Distance. The test separation was measured with a tape at approximately 3 meters.
- Lux measurement. The HL200 recorded illuminance at its labeled low-beam and high-beam sensor positions.
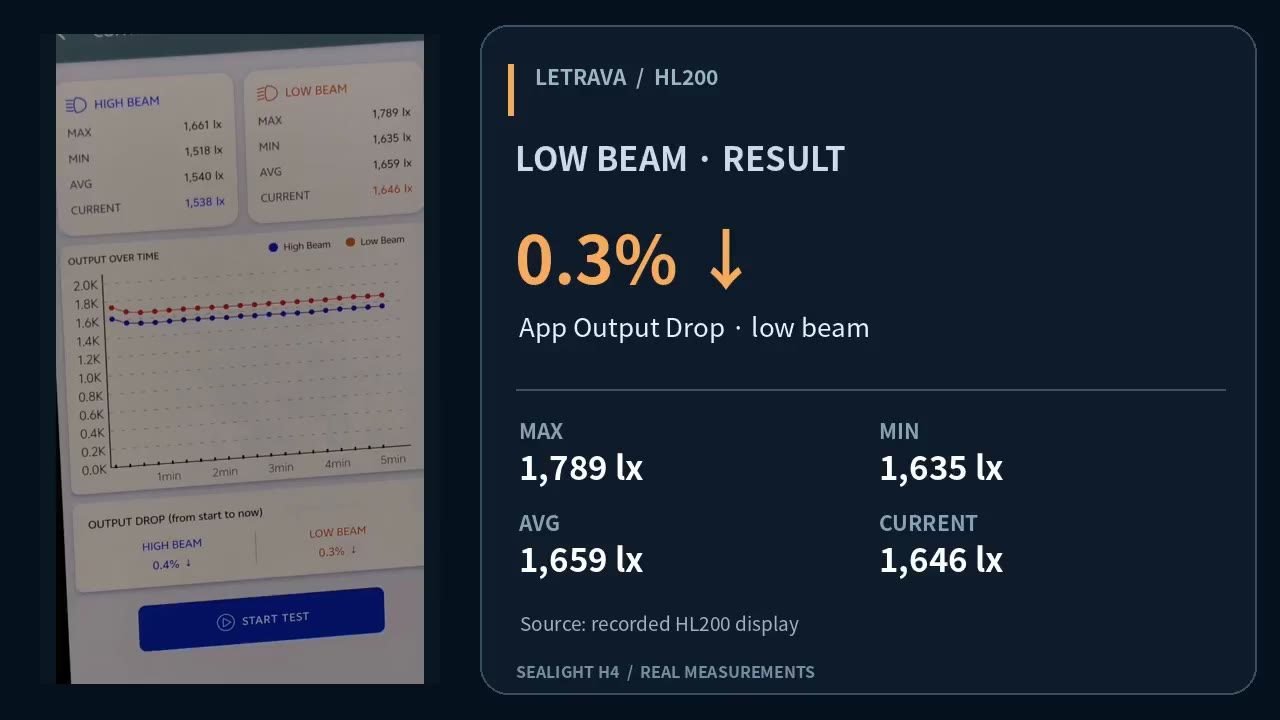
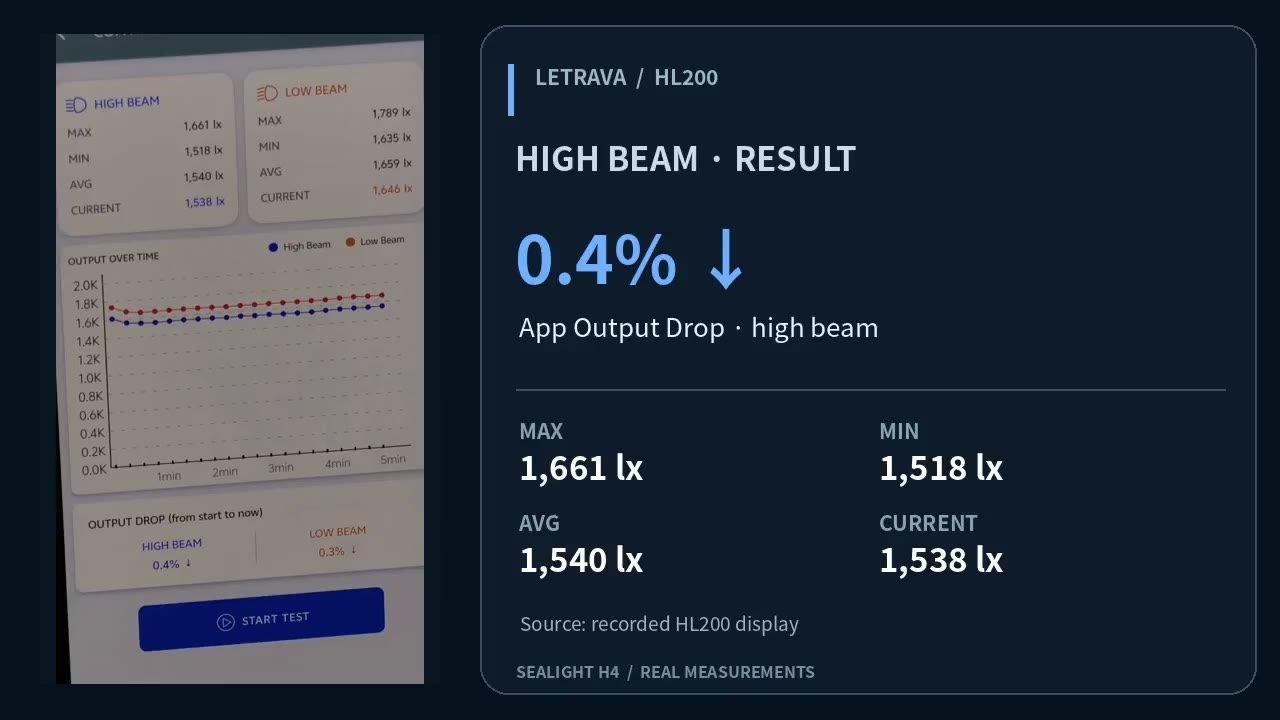
- Continuous monitoring. The recorded test display provided MAX, MIN, AVG, CURRENT and the application's Output Drop for each channel over approximately five minutes.
- Review. The on-screen final statistics are reported below without converting point illuminance to lumens.
Recorded results: low vs. high beam sensor positions
The table reports the display values captured at the end of the continuous recording. Each channel represents illuminance measured at its own sensor location, not the total light output of an individual beam.
| On-screen statistic | Low-beam position | High-beam position |
|---|---|---|
| Maximum (MAX) | 1,789 lx | 1,661 lx |
| Minimum (MIN) | 1,635 lx | 1,518 lx |
| Average (AVG) | 1,659 lx | 1,540 lx |
| Current at end | 1,646 lx | 1,538 lx |
| Displayed Output Drop | 0.3% ↓ | 0.4% ↓ |
What do these illuminance results mean?
1. A timed measurement answers a different question from a snapshot
A single lux reading describes illuminance at one sensor position and moment. A continuous record adds time context: the measurement may rise, fall or fluctuate even when its final value is near the starting reference. That is why reporting only an end-to-start percentage can obscure the larger MAX-to-MIN range.
2. Low-beam and high-beam sensors occupy different positions
It would be misleading to conclude that one headlight beam is brighter or safer simply because a channel recorded a higher lux value. The positions receive different portions of the beam pattern. Lux is not total luminous flux, and it cannot be converted to lumens without additional spatial measurements.
3. The results belong to this bench setup
The recorded test is evidence of what the two sensor positions measured under these conditions. It does not establish on-road visibility, glare compliance, long-term bulb reliability, or the cause of any observed fluctuations. Those questions would require additional controls and measurements.
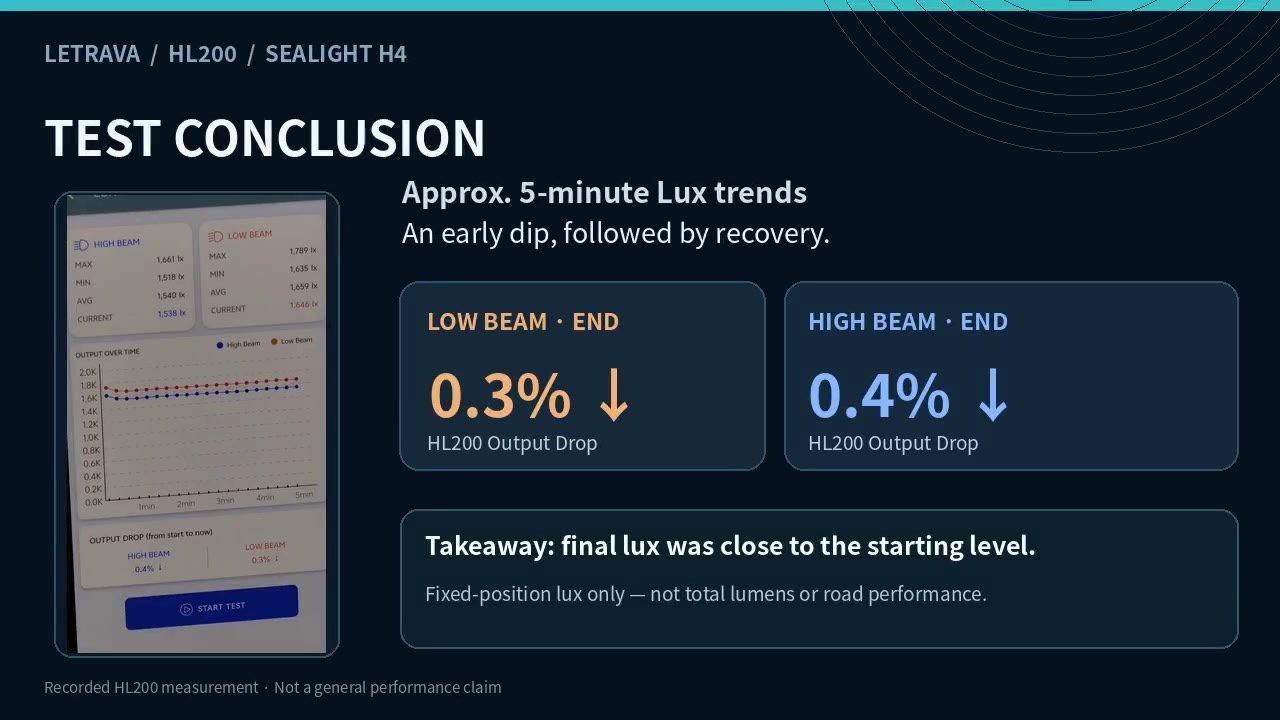
Video summary screen: measured values, not estimated lumen ratings.
Frequently asked questions
Was the test conducted on a road?
No. This was a bench headlight-assembly measurement at approximately 3 meters, not a road-use or regulatory photometry test.
Does 0.3% output drop mean the low-beam reading varied by only 0.3%?
No. The application reports a difference relative to its starting reference at the captured end. The recorded minimum and maximum show that readings varied over a wider range during the monitoring period.
Why use two measurement positions?
Different sensor locations help document how much illuminance reaches each selected point. They should not be interpreted as isolating the total luminous output of the high- or low-beam lamps.
What measuring instrument appears in the video?
The test used the Letrava HL200 automotive headlight lux/CCT meter. Instrument details and the separate high- and low-beam measurement approach are available on its product information page.
Measurement tool shown in this test
The Letrava HL200 is designed for automotive headlight illuminance measurement and continuous output monitoring. Learn about the instrument separately from these third-party bulb observations.
Explore the HL200 test instrument