Watch the actual test—start to finish
Watch the bulb, installation, headlamp housing, measured distance, beam pattern, low- and high-beam readings, continuous test graphs, and the separate electrical power investigation. This video uses our original test footage.
Full test video: 3 minutes 31 seconds · English · 16:9. Download / open MP4
Initial brightness doesn't tell the whole story
LED headlight upgrade videos often focus on how the light looks immediately after switch-on. That comparison is useful, but it cannot show whether the output remains at the same level after several minutes of operation.
For this experiment, we used a TERMITOR H4 LED headlight bulb mounted in a headlamp housing, measured illuminance and correlated color temperature (CCT) with the Letrava HL200 headlight tester, and followed the low-beam and high-beam outputs separately during continuous tests.
We noticed a substantial downward trend in the measured lux readings. That led to a second question: was the electrical input power also changing? In a separate test we recorded a steady nominal 13 V supply while the current—and therefore calculated input power—declined over about five minutes.
How we set up the headlight measurements
TERMITOR H4 LED bulb inspected and installed in a headlamp housing.
Approximately 3 m between the light and controlled measurement position.
Letrava HL200 used for low/high beam illuminance, CCT and continuous-test readings.
Separate bench-supply measurement at approximately 13.00 V for about five minutes.
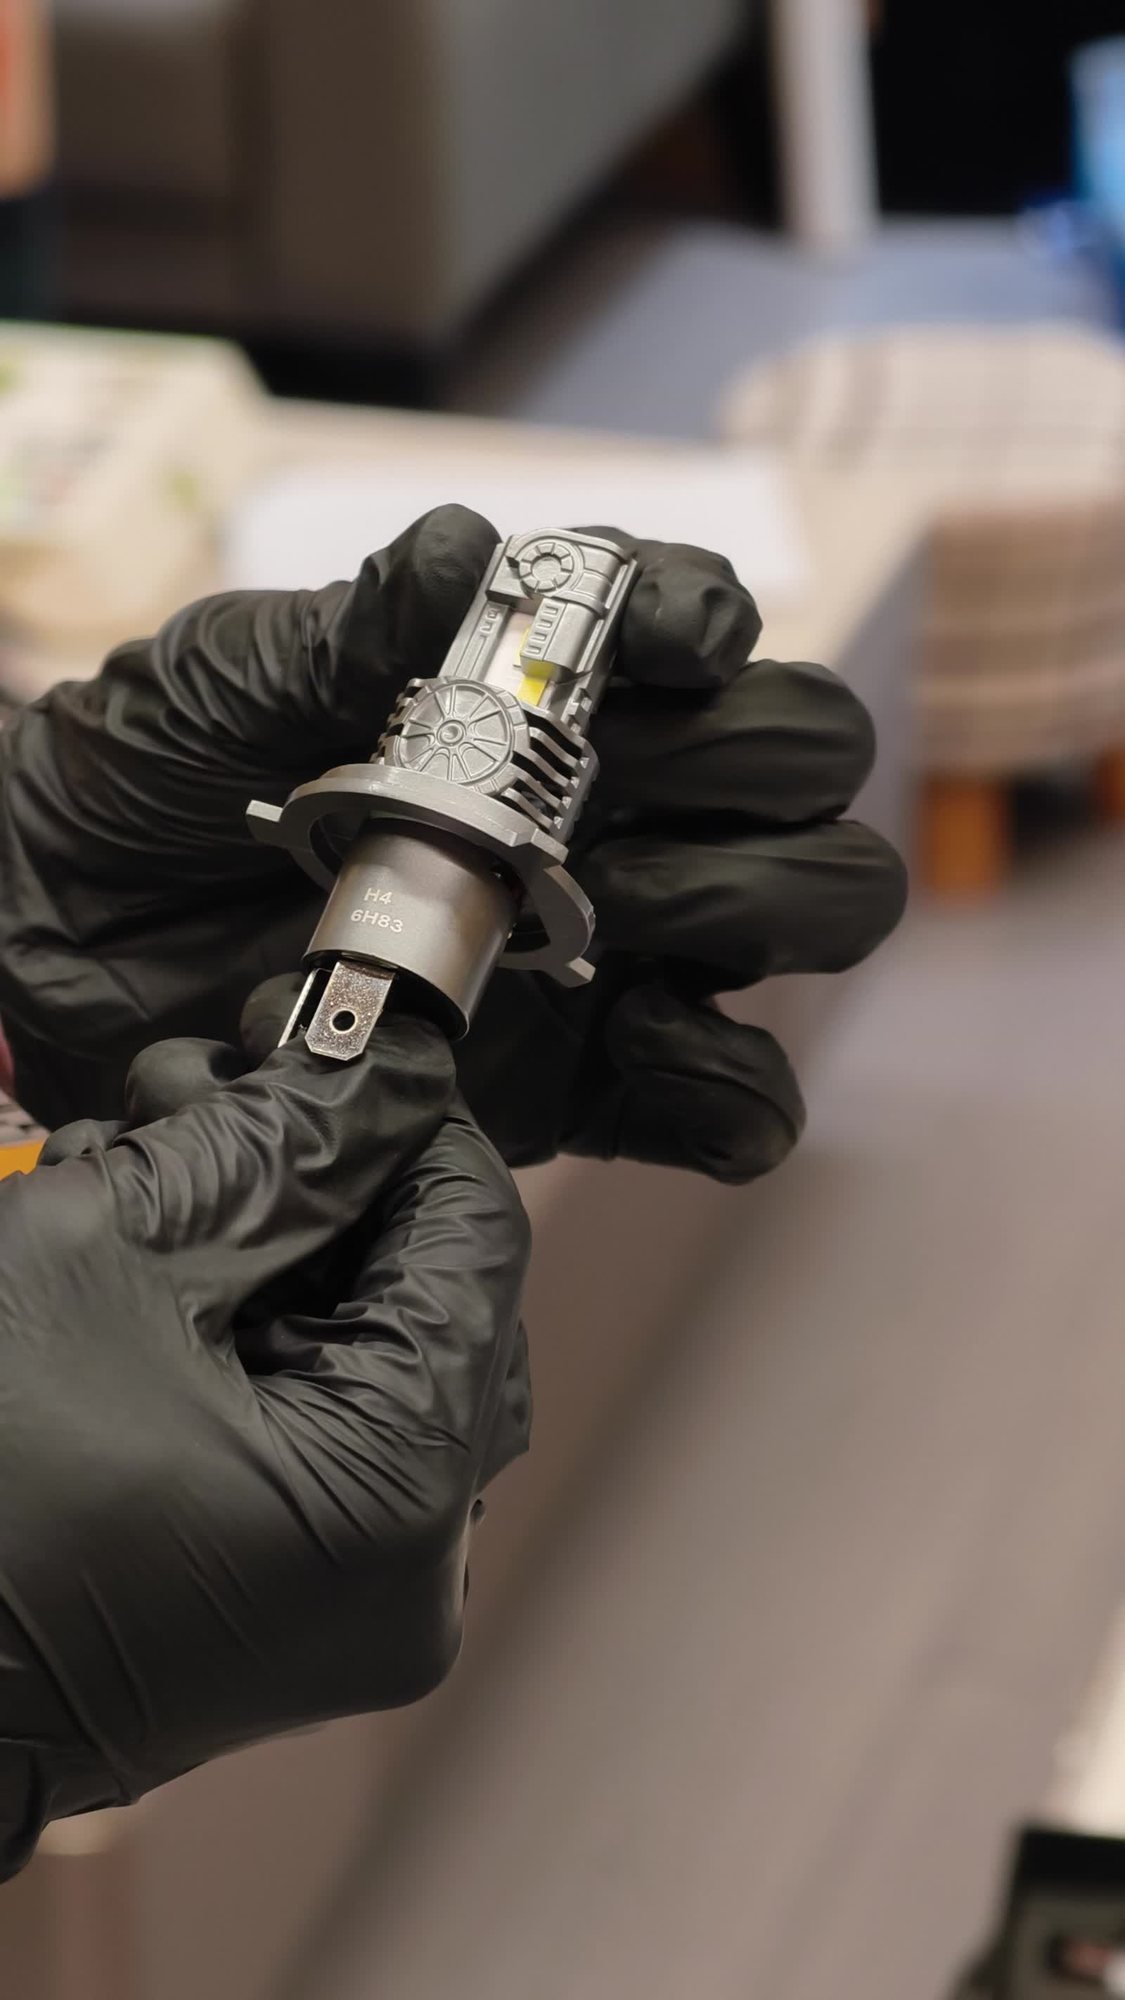
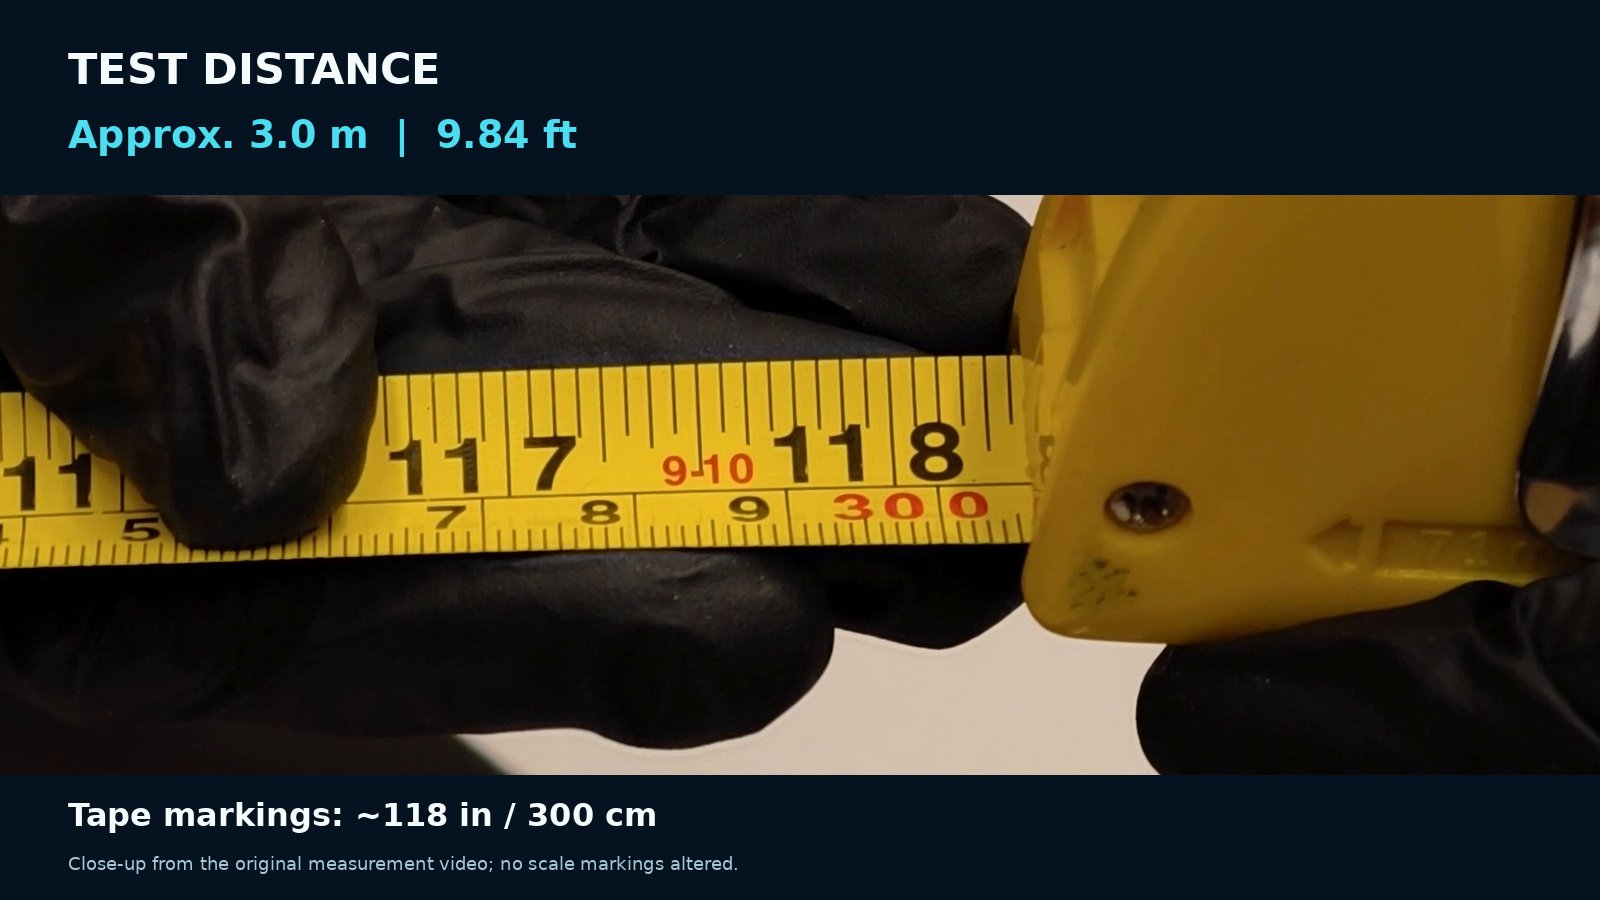
A lux reading refers to illuminance at the specific HL200 sensor position. It is not total luminous flux in lumens, and this bench experiment is not a vehicle-road-illumination or regulatory beam-compliance test. Measurement position and beam aim influence the absolute lux values.
Low-beam and high-beam results
The immediate readings and the continuous-test summaries below come from different moments in the captured tests. We present them separately instead of pretending that every number was acquired at the same time.
| Measurement | Low beam | High beam |
|---|---|---|
| Single observed illuminance reading | 1,987 lx | 4,823 lx |
| Observed CCT at that reading | 5,361 K | 5,514 K |
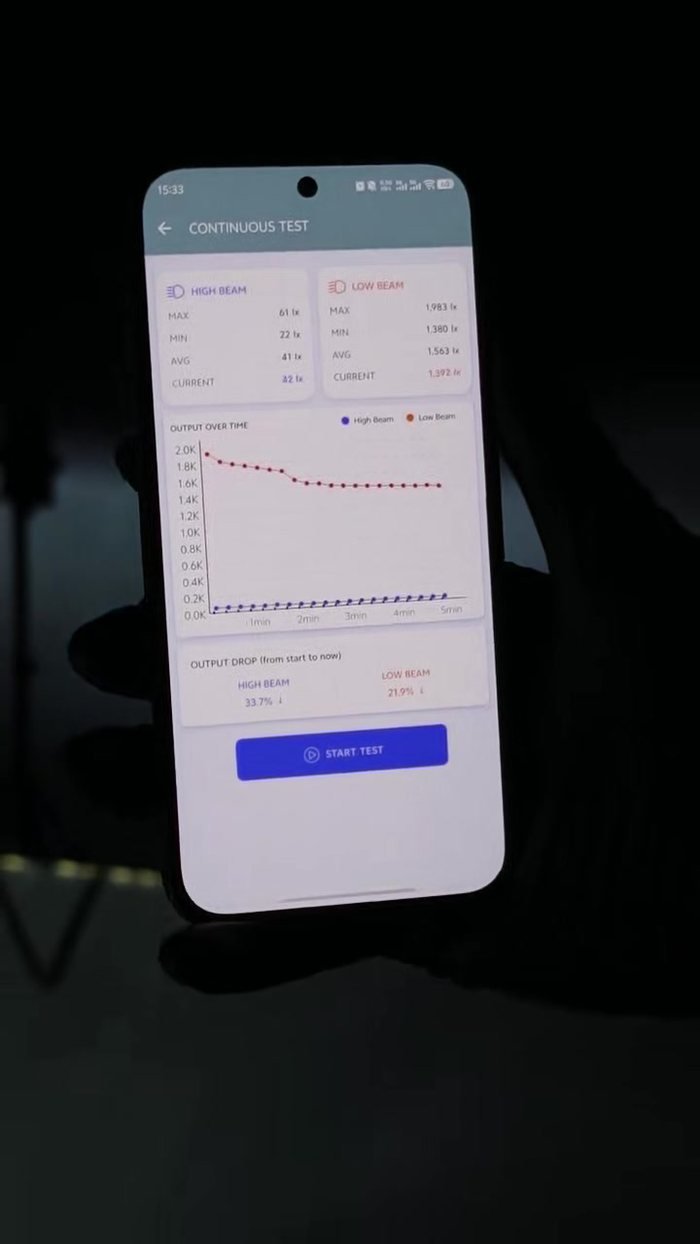
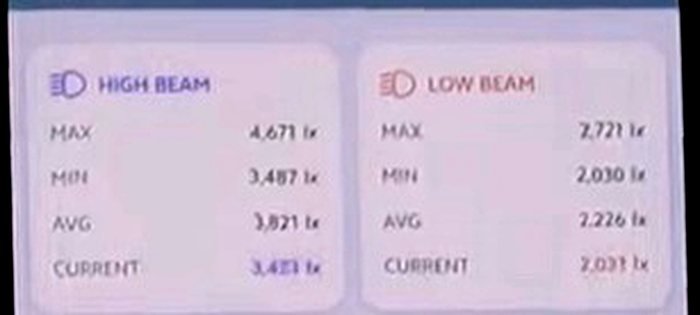
| Continuous-test MAX | 1,983 lx | 4,671 lx |
| Continuous-test MIN | 1,380 lx | 3,487 lx |
| Continuous-test AVG | 1,563 lx | 3,871 lx |
| Continuous-test CURRENT at captured end | 1,392 lx | 3,489 lx |
| MAX-to-MIN change | −30.4% | −25.3% |
| HL200 app “Output Drop” displayed | 21.9% | 20.4% |
The MAX-to-MIN percentages are independently calculated as (MAX − MIN) / MAX × 100: low beam (1,983 − 1,380)/1,983 ≈ 30.4%, high beam (4,671 − 3,487)/4,671 ≈ 25.3%. The app's Output Drop uses its own beginning-to-current reference, so the percentages need not match.
What did the continuous tests show?
In both beam modes, the captured trends moved downward and then became more gradual. A one-time measurement at switch-on would not have shown this temporal behavior. We do not interpret the lux decline as a precise change in emitted lumens or as proof of reduced road visibility: the sensor captures illuminance at a fixed point in the beam.
Color temperature was also documented during the single readings: 5,361 K for the recorded low-beam snapshot and 5,514 K for the recorded high-beam snapshot. Those readings describe the measured light at those moments, not a full CCT stability study.
Input power also decreased during a separate 5-minute test
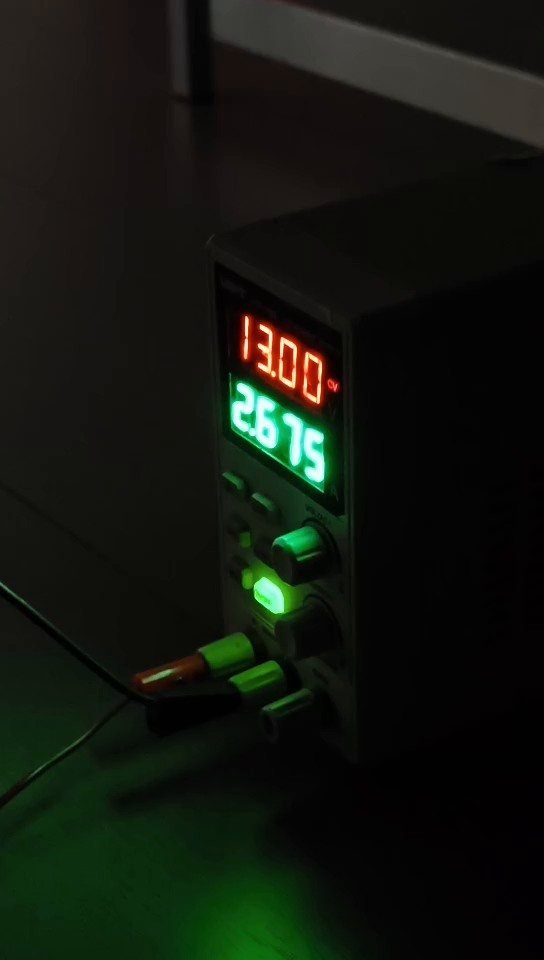
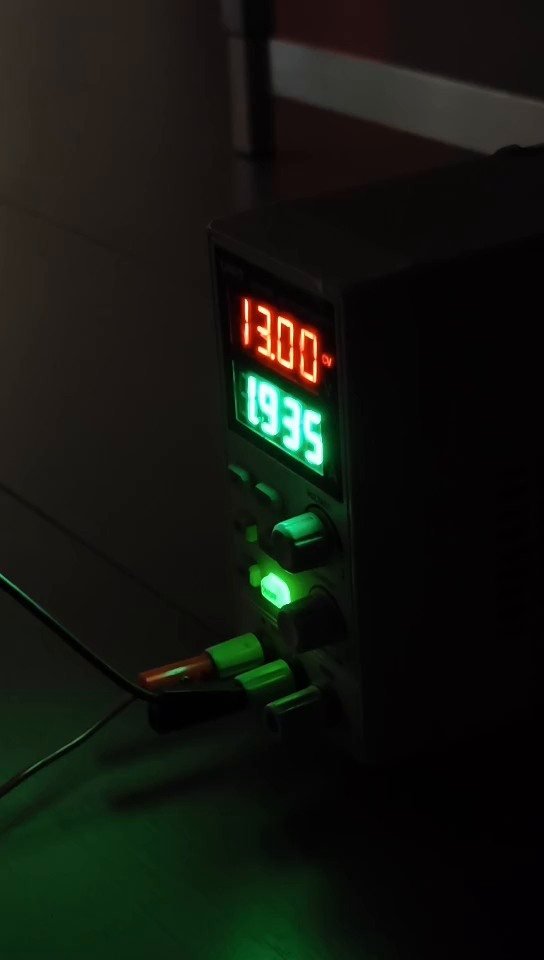
With the power supply set to approximately 13.00 V, its current reading fell from about 2.675 A near the start to 1.935 A near the end. Using P = V × I, that corresponds to approximately 34.78 W → 25.16 W of input power—a 27.7% decrease.
| Elapsed video time | Nominal voltage | Current | Calculated input power |
|---|---|---|---|
| 5 seconds | 13.00 V | 2.675 A | 34.77 W |
| 30 seconds | 13.00 V | 2.593 A | 33.71 W |
| 60 seconds | 13.00 V | 2.554 A | 33.20 W |
| 120 seconds | 13.00 V | 2.114 A | 27.48 W |
| 180 seconds | 13.00 V | 2.011 A | 26.14 W |
| 240 seconds | 13.00 V | 1.961 A | 25.49 W |
| 299 seconds | 13.00 V | 1.935 A | 25.16 W |
Measurements and times are approximate video-frame transcriptions. The supply was being adjusted in a short opening sequence; that adjustment is excluded from the normal-operation comparison.
What explains the drop—and what remains unproven?
Two separate observations point in the same direction: measured illuminance decreased, and input power decreased under approximately constant supply voltage.
What our recordings support
- Both low- and high-beam runs showed notable decreases between their recorded maxima and minima.
- In the separate power test, input current and calculated power decreased over approximately five minutes while the supply showed roughly 13.00 V.
- The changes are consistent with a lower electrical drive level contributing to the observed illuminance loss.
What we are not claiming
- We did not record bulb/driver temperature, so thermal derating remains a hypothesis.
- Lux and input power were not collected as a synchronized pair of datalogger time series.
- We cannot infer whole-beam lumens, road-safety compliance or performance across every unit of this model from one documented bench setup.
Thermal management or driver behavior is a plausible line of investigation, but controlled temperature measurements, repeat runs and synchronized power-versus-lux logging would be needed to establish the mechanism. The data shown here should be read as a case study of this tested setup, not a universal verdict on TERMITOR products.
Three things to check in any LED headlight upgrade
- Initial lux at a controlled sensor point. Start with a consistent distance, height, beam mode and aim.
- Lux after warm-up. Record a time series instead of relying only on the first few seconds.
- Supply and electrical behavior. If output falls, inspect input voltage/current and, when possible, LED/driver temperature before assigning a cause.
The Letrava HL200 supports lux and CCT measurements, independent high- and low-beam readings, and continuous output tracking. Electrical power in this case was measured separately with a DC supply; HL200 itself does not measure electrical watts.
Download the values documented in this post
These files contain manually transcribed readings from the video. They are provided for checking the arithmetic and quoting specific observations. They are not original device CSV exports or a synchronized raw dataset.
Headlight measurement summary (CSV) · Power checkpoints (CSV)
FAQ about this H4 LED test
Did the TERMITOR H4 LED lose 30% of its light output?
Its measured low-beam illuminance at the HL200 position fell 30.4% from the recorded maximum to minimum in our test. That does not establish a 30.4% reduction in total emitted lumens.
Was the power decrease the proven cause of the lux drop?
The separate 13 V power test showed a 27.7% drop in input power over roughly five minutes, consistent with the direction and scale of the lux changes. Without synchronized measurements, a causal breakdown cannot be established.
Does this prove the LED driver is overheating?
No. Thermal derating is a plausible hypothesis, but we did not measure the LED or driver temperatures.
What does the Letrava HL200 measure?
HL200 measures illuminance (lux), correlated color temperature (CCT), independent beam modes, and changes in illuminance during continuous testing. It does not measure input current or electrical power.
Don't just compare how headlights look. Measure how they perform.
The Letrava HL200 helps automotive lighting technicians, reviewers and enthusiasts measure real illuminance at a consistent position, compare CCT, and document output changes after warm-up.
Explore the HL200 Headlight TesterWatch This Test AgainTest recorded November 12, 2026 · Letrava, an independent measurement-tool brand · TERMITOR is a trademark of its respective owner. This test is not presented as a sponsorship, certification result, or manufacturer-endorsed evaluation.